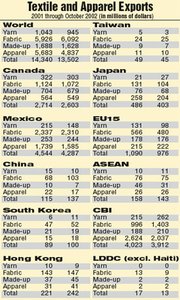
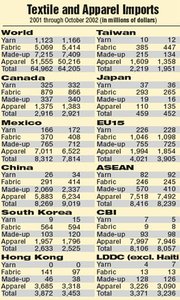
Textile and Apparel Imports and Exports
Mexico, China and the Caribbean Basin continued to be the main sources for apparel and textile imports in 2002, accounting for $22.1 billion in trade through the first three quarters of the year. Imports from these countries and Asia made up more than half of the $57 billion in soft goods imported into the United States, about the same as last year and about five times higher than U.S. exports.
Trade with China grew by nearly 10 percent, affecting imports from other Asian nations—an 11 percent drop in traffic from Hong Kong and a 10 percent shortfall from Taiwan. Mexican imports declined 7 percent followed by a slight decline from CBI of 1.8 percent.
China’s joining the World Trade Organization (WTO), which provides for the phased liberalization and elimination of quotas on textiles and apparel imported from WTO member countries, should have considerable effects on U.S. trade going forward.
Recent amendments to the Caribbean Basin Economic Recovery Act (CBERA) and the African Growth and Opportunity Act (AGOA) may also affect trade as these changes offer incentives to those countries’ producers who use U.S.-based fabrics and materials.
Whether this substantially aids U.S.- based textile producers remains to be seen as domestic producers continue to struggle with plant closures and offshore competition.
Exports to NAFTA nations Canada and Mexico declined 5 percent and 6 percent respectively through the first three quarters of 2002. U.S. exports to Canada accounted for $2.3 billion, while Mexican exports totaled $3.8 billion, followed by the CBI with $3.4 billion, a 4.3 percent drop. Total exports fell 6.8 percent to $12 billion. —Robert McAllister


